Code introduction
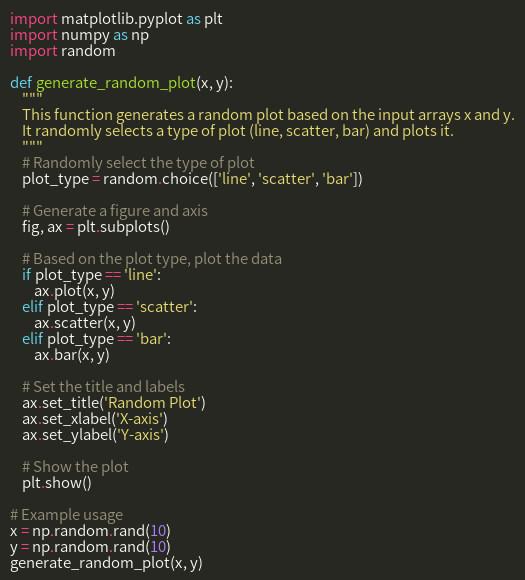
This code defines a function that accepts two arrays x and y as input, randomly selects a line plot, scatter plot, or bar plot to draw, and displays it. The code uses the numpy library to generate random data, and the matplotlib library to draw graphics.
Technology Stack : numpy, matplotlib, random, numpy.random.rand, matplotlib.pyplot.subplots, matplotlib.pyplot.plot, matplotlib.pyplot.scatter, matplotlib.pyplot.bar, matplotlib.pyplot.title, matplotlib.pyplot.xlabel, matplotlib.pyplot.ylabel, matplotlib.pyplot.show
Code Type : The type of code
Code Difficulty :
import matplotlib.pyplot as plt
import numpy as np
import random

def generate_random_plot(x, y):
    """
    This function generates a random plot based on the input arrays x and y.
    It randomly selects a type of plot (line, scatter, bar) and plots it.
    """
    # Randomly select the type of plot
    plot_type = random.choice(['line', 'scatter', 'bar'])

    # Generate a figure and axis
    fig, ax = plt.subplots()

    # Based on the plot type, plot the data
    if plot_type == 'line':
        ax.plot(x, y)
    elif plot_type == 'scatter':
        ax.scatter(x, y)
    elif plot_type == 'bar':
        ax.bar(x, y)

    # Set the title and labels
    ax.set_title('Random Plot')
    ax.set_xlabel('X-axis')
    ax.set_ylabel('Y-axis')

    # Show the plot
    plt.show()

# Example usage
x = np.random.rand(10)
y = np.random.rand(10)
generate_random_plot(x, y)

